Image Resize
In this tutorial we will learn how to resize an image using OpenCV.
What is Interpolation?
Interpolation is a technique of estimating the values of a continuous function from discrete samples. or decrease the pixels in a digital image. It helps in resampling an image by assigning new grey values to resampled positions. In OpenCV the function cv2.resize() is used to resize an image.
These are some interpolation methods for resizing.
-
cv2.INTER_NEAREST
-
cv2.INTER_LINEAR
-
cv2.INTER_AREA
-
cv2.INTER_CUBIC
Some important factors used in OpenCV for image resizing -
-
Src - it is the source or input image.
-
dsize - it is the size of the desired output image.
-
Fx - it is the scale factor along the horizontal axis.
-
Fy - it is the scale factor along the vertical axis.
Now, let's understand the whole concept with some practical work.
Example:
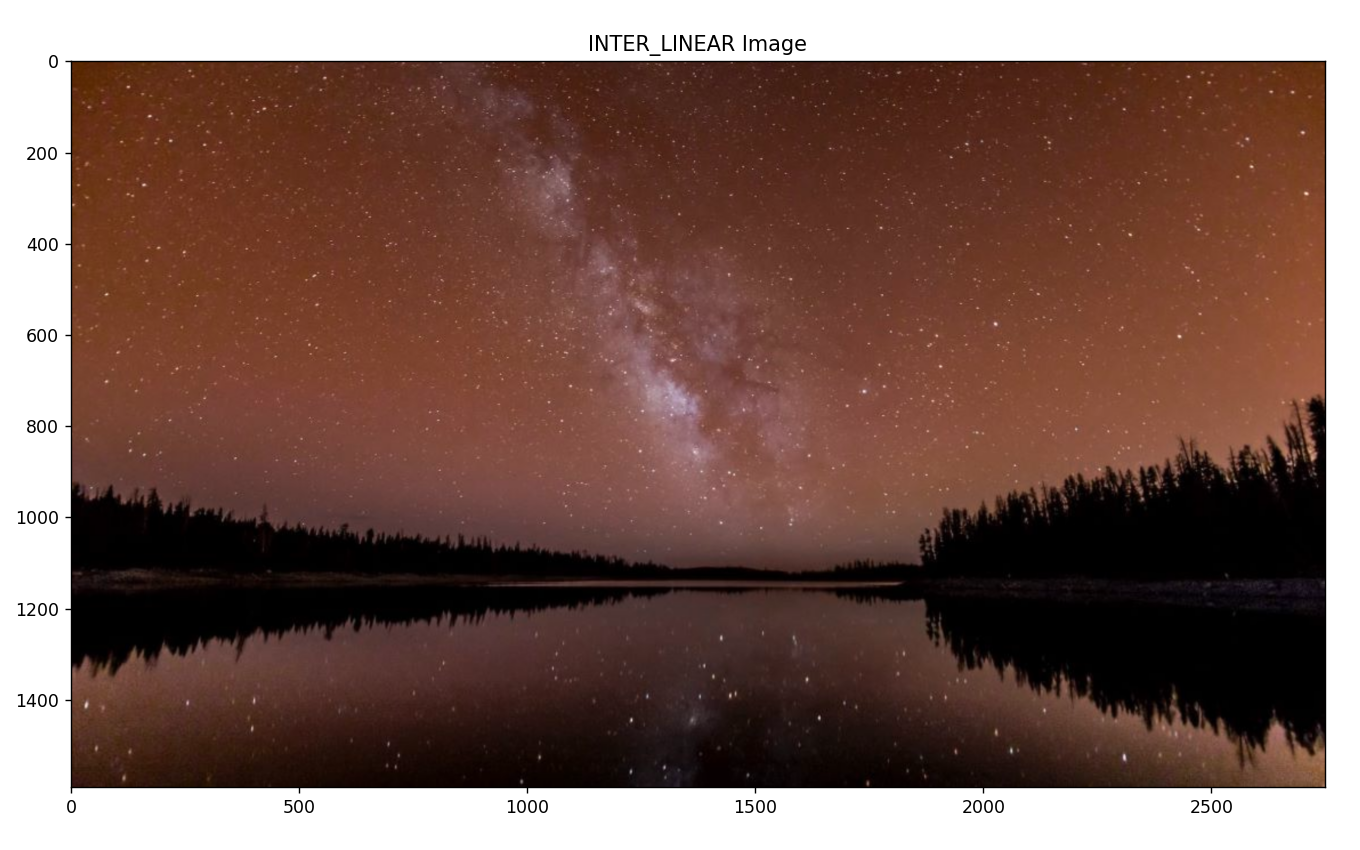
Code for INTER_LINEAR interpolation:
import cv2
import matplotlib.pyplot as plt
img = cv2.imread('sum_a.jpg')
image_resized = cv2.resize(img, (100,100))

img_size1 = cv2.resize(img, None, fx=2.5, fy=2.5, interpolation=cv2.INTER_LINEAR)

plt.subplot(111),plt.imshow(img_size1), plt.title("INTER_LINEAR Image")
plt.show()
cv2.waitKey(0)
cv2.destroyAllWindows()
Here, first we imported cv2 and and matplotlib.pyplot. then we used cv2.imread to read image of the given path. Then we used cv2.resize function to resize the input image.
Result:
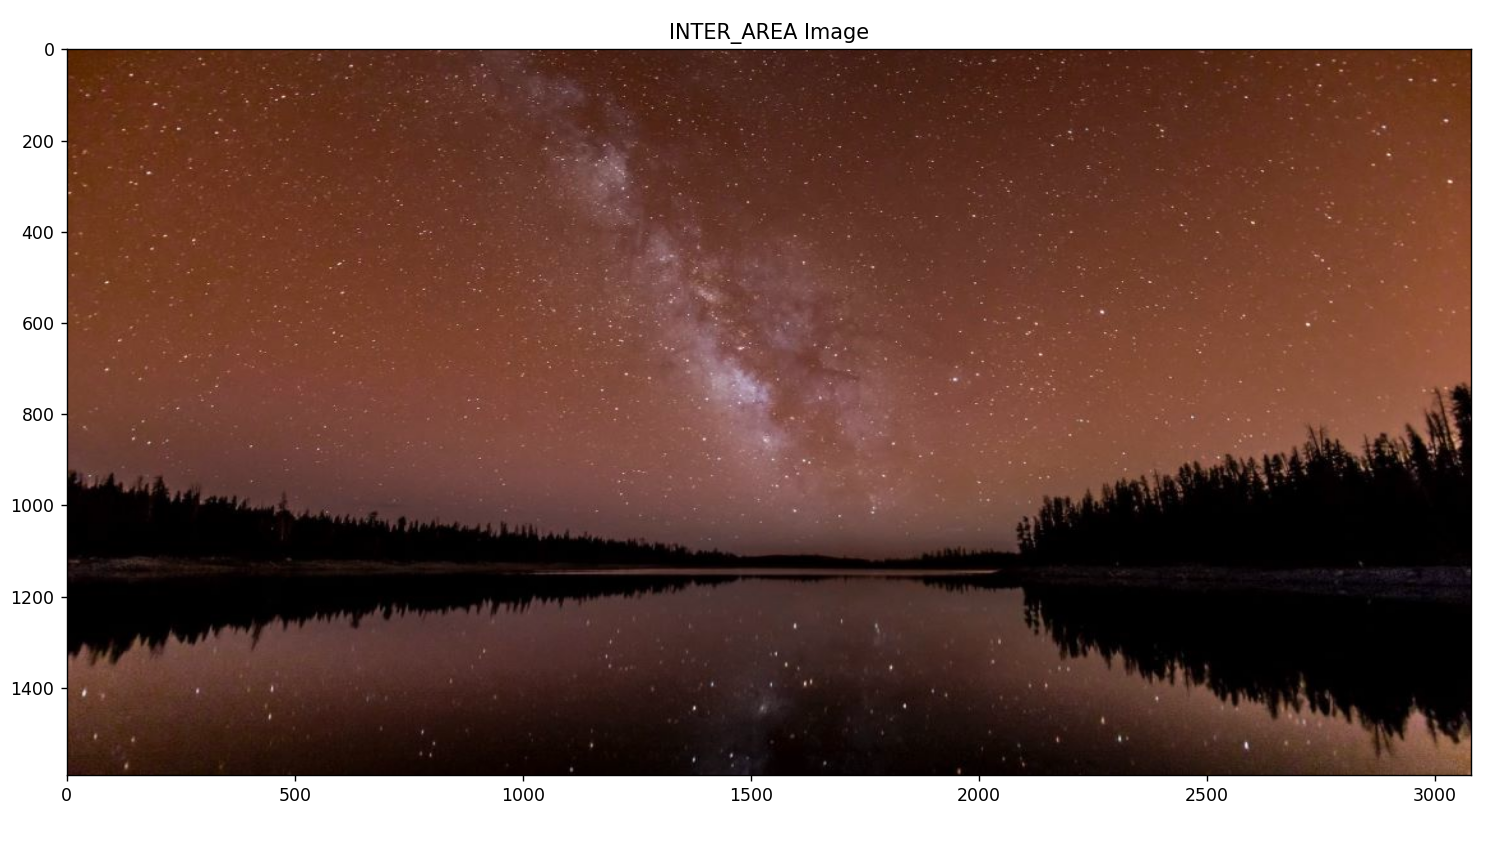
Code for INTER_AREA interpolation:
import cv2
import matplotlib.pyplot as plt
img = cv2.imread('sum_a.jpg')
image_resized = cv2.resize(img, (100,100))

img_size1 = cv2.resize(img, None, fx=2.8, fy=2.5, interpolation=cv2.INTER_AREA)

plt.subplot(111),plt.imshow(img_size1), plt.title("INTER_AREA Image")
plt.show()
cv2.waitKey(0)
cv2.destroyAllWindows()
Here, all the same code as previous but we changed the axis size and used INTER_AREA interpolation.
Result:
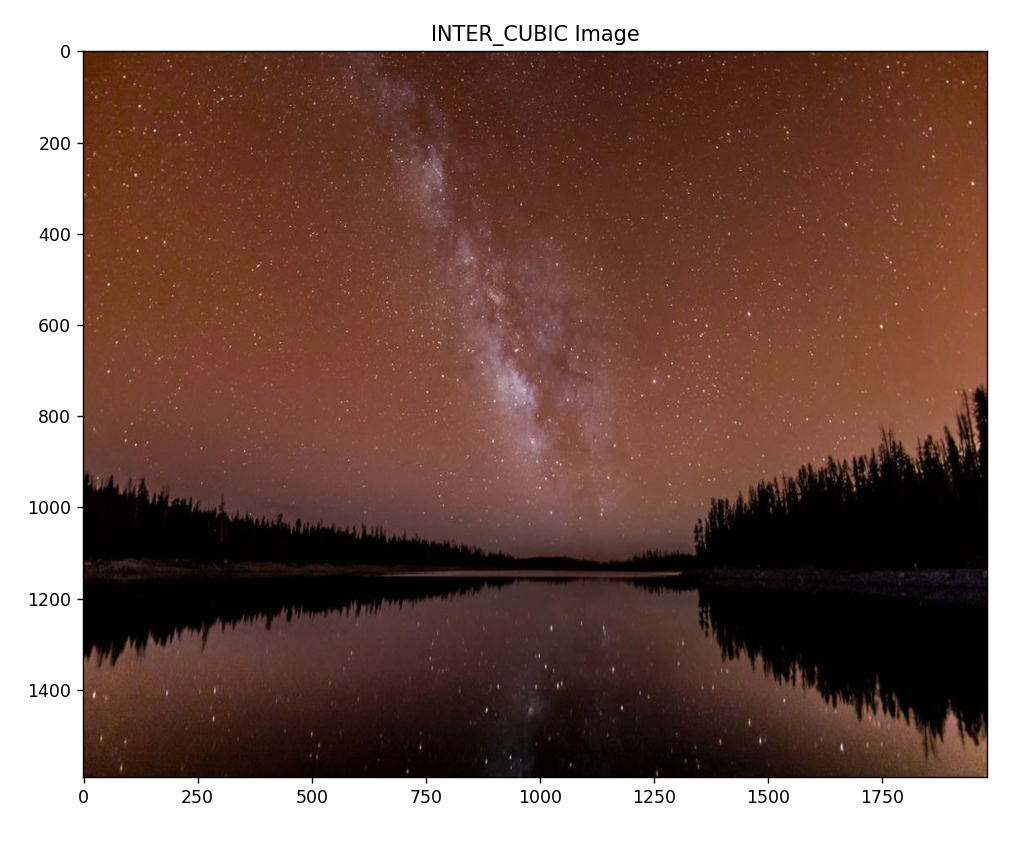
Code for INTER_CUBIC interpolation:
import cv2
import matplotlib.pyplot as plt
img = cv2.imread('sum_a.jpg')
image_resized = cv2.resize(img, (100,100))

img_size1 = cv2.resize(img, None, fx=1.8, fy=2.5, interpolation=cv2.INTER_CUBIC)

plt.subplot(111),plt.imshow(img_size1), plt.title("INTER_CUBIC Image")
plt.show()
cv2.waitKey(0)
cv2.destroyAllWindows()
Here, all the same code as previous but we changed the axis size and used INTER_CUBIC interpolation.
Result: