Difference between plt.plot() and ax.plot()
Description:
This is a fundamental distinction in Matplotlib. As a beginner, you’ll often see plt.plot() used, and that’s okay for quick plots. But as you grow and your projects scale, you’ll need to understand ax.plot() — which is part of the object-oriented (OO) approach — to build more structured, reusable, and professional-quality visualizations.
●plt.plot() is part of Matplotlib's state-based (pyplot) interface. It's designed for simplicity and mimics MATLAB-style coding. It works by implicitly tracking the current figure and axes, which is why you don’t need to explicitly create them.
●ax.plot() belongs to the object-oriented interface. You explicitly create the figure and Axes objects using fig, ax = plt.subplots(), and then you call methods on these objects
Why the difference matters:
●plt.plot() is convenient but less flexible when you need multiple subplots or want to customize individual axes.
●ax.plot() gives you precise control over each subplot, legend, title, and styling — it’s the professional way of doing things.
Code Explanation:
● import matplotlib.pyplot as plt: Imports the Matplotlib Pyplot module.
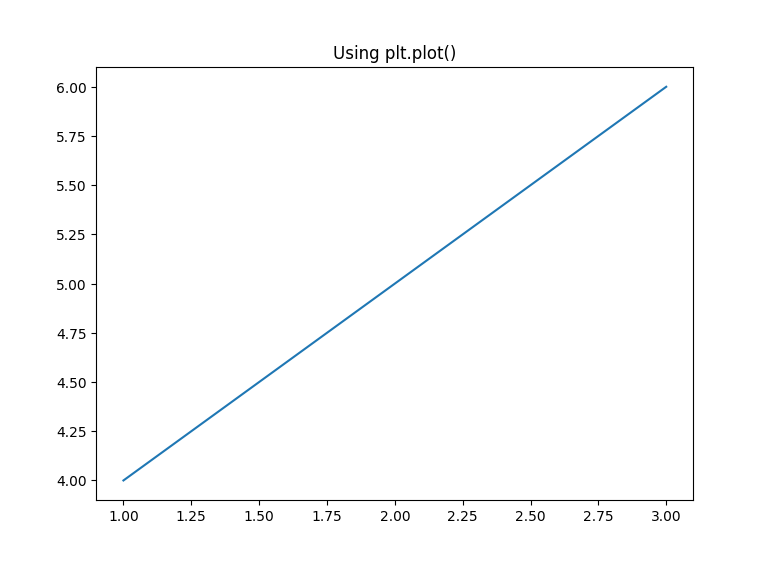
● plt.plot(...): Creates a plot using the state-based Pyplot API, where the current figure and axes are managed implicitly.
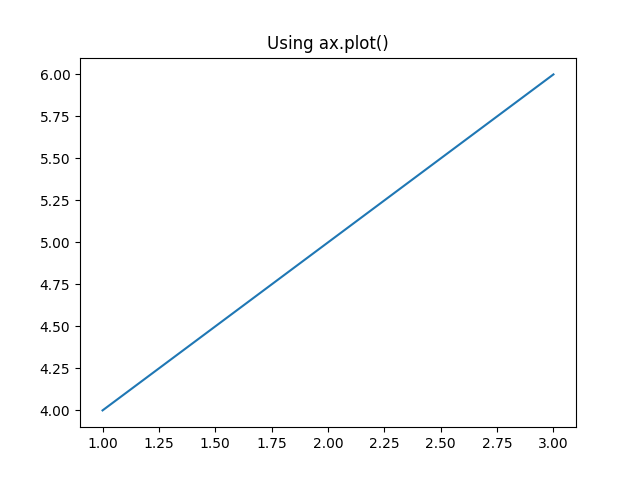
● fig, ax = plt.subplots(): Initializes a Figure and Axes object explicitly using the object-oriented interface.
● ax.plot(...): Plots data directly on a specific Axes object, allowing better layout control and reuse.
● plt.show(): Renders and displays the plots.
Program:
import matplotlib.pyplot as plt

# Using state-based interface
plt.plot([1, 2, 3], [4, 5, 6])
plt.title("Using plt.plot()")
plt.show()

# Using object-oriented interface
fig, ax = plt.subplots()
ax.plot([1, 2, 3], [4, 5, 6])
ax.set_title("Using ax.plot()")
plt.show()
Output: