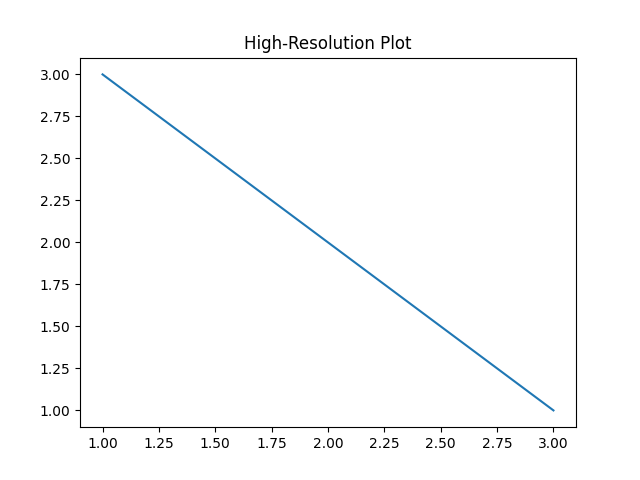
Description:
When you save plots as images, DPI (dots per inch) is what controls the quality and resolution of the output. DPI becomes especially important when you're preparing figures for presentations, research papers, or print publications.
● By default, Matplotlib saves figures at 100 DPI, which is fine for on-screen use but will look blurry when printed or zoomed in.
● Use the dpi parameter in plt.savefig() (e.g., dpi=300) to export high-resolution images.
● A DPI of 300 or above is standard for print-quality graphics.
● Combine this with bbox_inches='tight' to remove unnecessary white space from around your plot.
● Also note: if you’re working in Jupyter Notebook and your images look fuzzy, increasing the DPI can dramatically improve clarity.
Code Explanation:
● plt.plot(...): Plots a basic line chart.
● plt.title(...): Adds a title to the chart.
● plt.savefig("plot.png", dpi=300): Saves the chart as a PNG file with a resolution of 300 DPI.
● dpi=300: Sets the output image to high quality (suitable for print).
● plt.show(): Displays the chart window.
Program:
import matplotlib.pyplot as plt

plt.plot([1, 2, 3], [3, 2, 1])
plt.title("High-Resolution Plot")
plt.savefig("plot.png", dpi=300)
plt.show()
Output:


Trainings :
UI UX Design Training in Indore | Python + DSA Training in Indore | DevOps Training in Indore | Data Analytics Training in Indore | Data Science Training in Indore | Full Stack Development Training in Indore | Web Development Training in Indore | Python and Django Training in Indore |Free Courses and Resource :
Verbal Aptitude | Matplotlib Tutorials | Examples | Interview Questions | Pandas Tutorials | Projects | Interview Questions | OpenCV Tutorials | Projects | Interview Questions | ExpressJS Tutorials | Projects | Interview Questions | Dart | Python Data Structures and Algorithms | Rust Tutorials | Projects | Interview Questions | Aptitude Tests | HackerRank Python | Django | MongoDB Tutorials | Examples | Interview Questions | NumPy Practice Questions | Python Tutorials by CodersDaily | Golang Tutorials | Projects | Interview Questions | React.js Tutorials | Verbal Ability Tutorial | MS Sql Server Tutorials | Examples | Interview Questions | Power BI Tutorials | Projects | Interview Questions | Example Dashboards | Numpy Tutorials | Projects | Interview Questions | Django REST Framework Tutorial | HackerRank C++ Solutions | Pandas Practice Questions | Tensor Flow | Python Practice Questions | C++ Tutorials | Quantitative Ability Tutorial | Google Sheets Mastery: From Basics to Dashboards | Langchain Tutorials | Javascript | Node.js Tutorials | HackerRank SQL Solutions | HackerRank DSA Solutions | Verbal Aptitude 2 | HackerRank Java Solutions | HTML Tutorial | TCS NQT Mock Test Series | Reasoning Ability Tutorial | CodeChef Python Solutions | HackerRank C Program Solutions | Leetcode Python Solutions | SQL Practice Question | Matplotlib Practice Questions |Interview Questions :
Pandas Tutorials | Projects | Interview Questions | ExpressJS Tutorials | Projects | Interview Questions | Django | Python Tutorials by CodersDaily | Golang Tutorials | Projects | Interview Questions | Numpy Tutorials | Projects | Interview Questions | Django REST Framework Tutorial | Matplotlib Practice Questions | Matplotlib Practice Questions | Matplotlib Practice Questions | Matplotlib Practice Questions | Matplotlib Practice Questions | Matplotlib Practice Questions | Matplotlib Practice Questions | Matplotlib Practice Questions | Matplotlib Practice Questions | Matplotlib Practice Questions |Top Colleges in India :
Indian Institute of Technology Bombay | Jaypee University of Engineering and Technology - Guna |