How to switch between inline and interactive backends?
Description:
Matplotlib supports multiple backends that control how and where plots are rendered—whether shown interactively in a window or embedded within environments like Jupyter Notebooks. Switching between inline and interactive backends is crucial for adapting your workflow to the development environment you're working in.
-
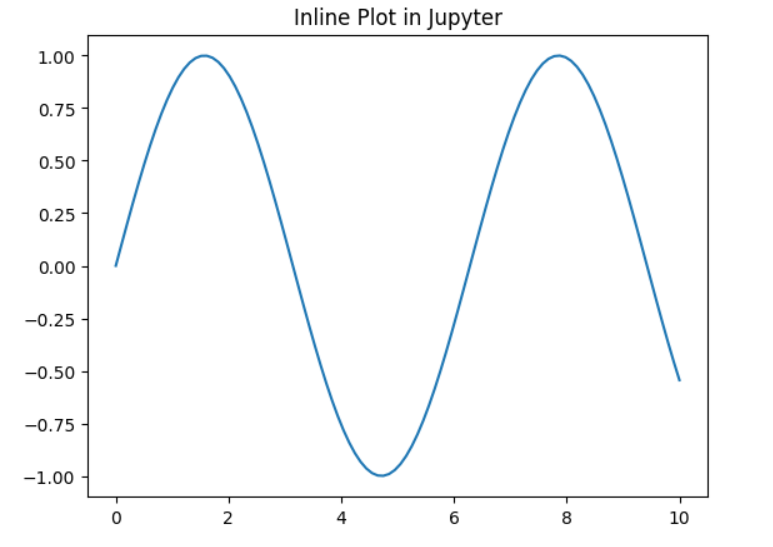
The inline backend is used in Jupyter Notebooks and renders plots inside the notebook cells. It’s static—once rendered, the image can’t be zoomed or panned. This is ideal for reports and reproducible research.
-
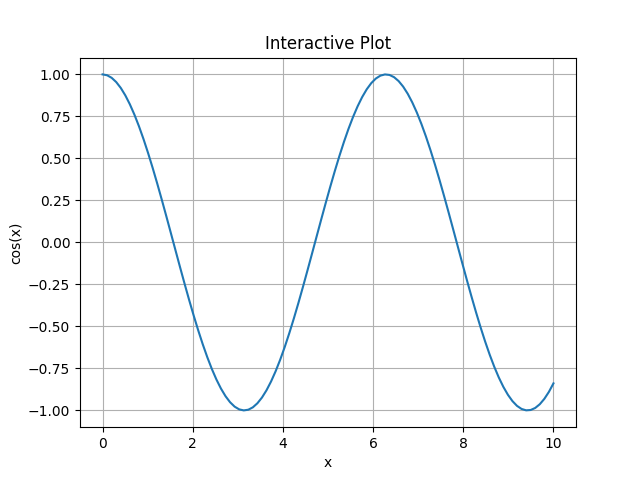
The interactive backends (like
TkAgg,QtAgg, orMacOSX) open plots in a separate resizable window, which allows for features like zoom, pan, and real-time updates. These are preferred in scripts or development IDEs like VS Code or PyCharm.
Code Explanation:
● import matplotlib: Imports the core Matplotlib module.
● matplotlib.use('TkAgg'): Sets the backend to a GUI windowing system (like TkAgg).
● import matplotlib.pyplot as plt: Must come after setting the backend.
● plt.plot(...): Plots data using the state-based interface.
● plt.title(...): Sets the title of the plot.
● plt.show(): Opens the plot in a separate interactive window.
Program:
# Jupyter magic command
%matplotlib inline

import matplotlib.pyplot as plt
import numpy as np

x = np.linspace(0, 10, 100)
y = np.sin(x)

plt.plot(x, y)
plt.title("Inline Plot in Jupyter")
plt.show()
#interactive plot
import matplotlib
matplotlib.use('TkAgg')  # You can also try 'QtAgg', 'MacOSX', etc.

import matplotlib.pyplot as plt
import numpy as np

x = np.linspace(0, 10, 100)
y = np.cos(x)

plt.plot(x, y)
plt.title("Interactive Plot")
plt.xlabel("x")
plt.ylabel("cos(x)")
plt.grid(True)
plt.show()
Output: