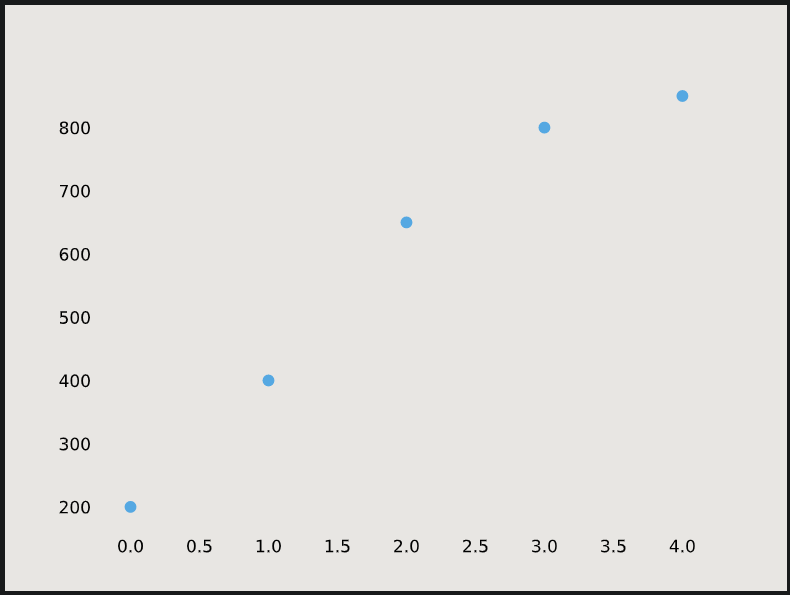
from matplotlib import pyplot as plt

time = [0, 1, 2, 3, 4]
revenue = [200, 400, 650, 800, 850]

plt.plot(time, revenue, 'o')
plt.show()

from matplotlib import pyplot as plt

y-points = [3,5,9,2,1,6,7,8]
plt.plot(y-points)
plt.show()

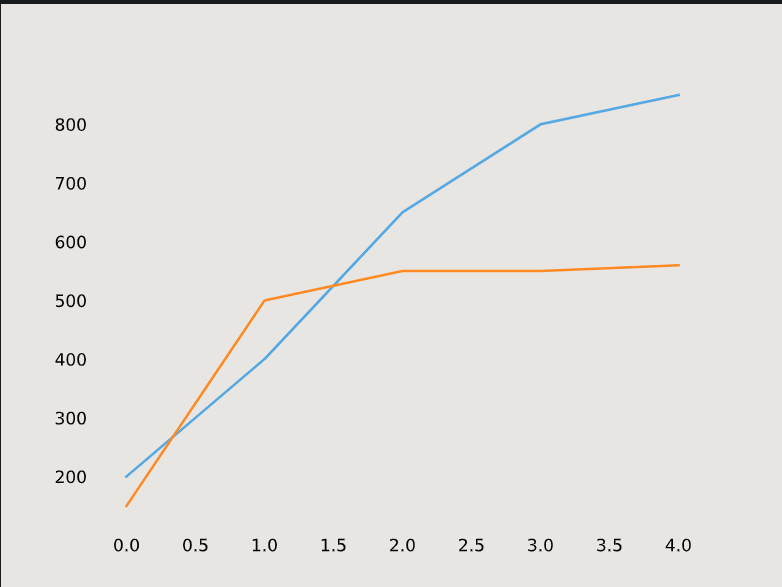
plt.plot() twice.
from matplotlib import pyplot as plt

lst1 = [0, 1, 2, 3, 4]
lst2 = [200, 400, 650, 800, 850]
lst3 = [150, 500, 550, 550, 560]

plt.plot(lst1, lst2)
plt.plot(lst1, lst3)
plt.show()


Trainings :
UI UX Design Training in Indore | Python + DSA Training in Indore | DevOps Training in Indore | Data Analytics Training in Indore | Data Science Training in Indore | Full Stack Development Training in Indore | Web Development Training in Indore | Python and Django Training in Indore |Free Courses and Resource :
Verbal Aptitude | Matplotlib Tutorials | Examples | Interview Questions | Pandas Tutorials | Projects | Interview Questions | OpenCV Tutorials | Projects | Interview Questions | ExpressJS Tutorials | Projects | Interview Questions | Dart | Python Data Structures and Algorithms | Rust Tutorials | Projects | Interview Questions | Aptitude Tests | HackerRank Python | Django | MongoDB Tutorials | Examples | Interview Questions | NumPy Practice Questions | Python Tutorials by CodersDaily | Golang Tutorials | Projects | Interview Questions | React.js Tutorials | Verbal Ability Tutorial | MS Sql Server Tutorials | Examples | Interview Questions | Power BI Tutorials | Projects | Interview Questions | Example Dashboards | Numpy Tutorials | Projects | Interview Questions | Django REST Framework Tutorial | HackerRank C++ Solutions | Pandas Practice Questions | Tensor Flow | Python Practice Questions | C++ Tutorials | Quantitative Ability Tutorial | Google Sheets Mastery: From Basics to Dashboards | Langchain Tutorials | Javascript | Node.js Tutorials | HackerRank SQL Solutions | HackerRank DSA Solutions | Verbal Aptitude 2 | HackerRank Java Solutions | HTML Tutorial | TCS NQT Mock Test Series | Reasoning Ability Tutorial | CodeChef Python Solutions | HackerRank C Program Solutions | Leetcode Python Solutions | SQL Practice Question | Matplotlib Practice Questions |Interview Questions :
Pandas Tutorials | Projects | Interview Questions | ExpressJS Tutorials | Projects | Interview Questions | Django | Python Tutorials by CodersDaily | Golang Tutorials | Projects | Interview Questions | Numpy Tutorials | Projects | Interview Questions | Django REST Framework Tutorial | Matplotlib Practice Questions | Matplotlib Practice Questions | Matplotlib Practice Questions | Matplotlib Practice Questions | Matplotlib Practice Questions | Matplotlib Practice Questions | Matplotlib Practice Questions | Matplotlib Practice Questions | Matplotlib Practice Questions | Matplotlib Practice Questions |Top Colleges in India :
Indian Institute of Technology Bombay | Jaypee University of Engineering and Technology - Guna |