Pie Charts
Charts
- In this tutorial, we are going to learn about how to create charts in matplotlib pyplot.
- In pyplot, we can use pie() function to draw pie charts.
- For instance:
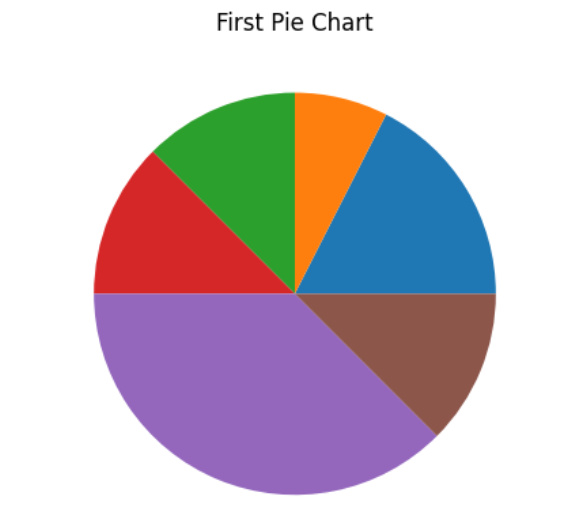
import matplotlib.pyplot as plt

y = [35, 15, 25, 25, 75, 25]
plt.title('First Pie Chart')
plt.pie(y)
plt.show()
Output:
-
Let's understand the mathematics behind the allotted region to each color here, well the size of each portion is calculated by comparing the value with sum of all other values:
y[i]/sum(y)
where i = index of y
Chart Labels
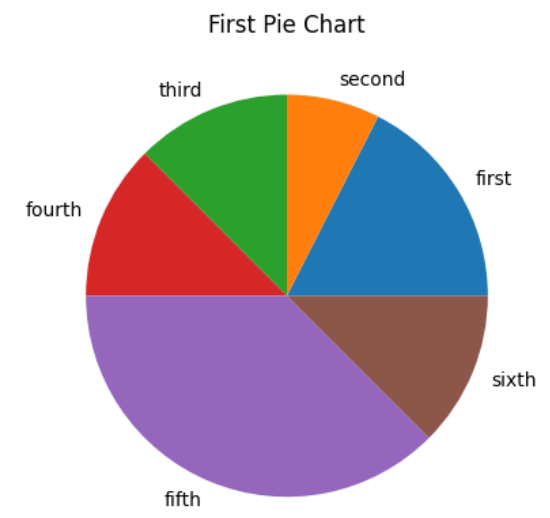
- We can add labels to our allotted portions with the labels parameter in pie() funciton.
- The label parameter should be an array with one label for each portion.
- Let's check this code below:
import matplotlib.pyplot as plt

y = [35, 15, 25, 25, 75, 25]
L = ['first','second','third','fourth','fifth','sixth']
plt.title('First Pie Chart')
plt.pie(y, labels = L)
plt.show()
Output :
Colors
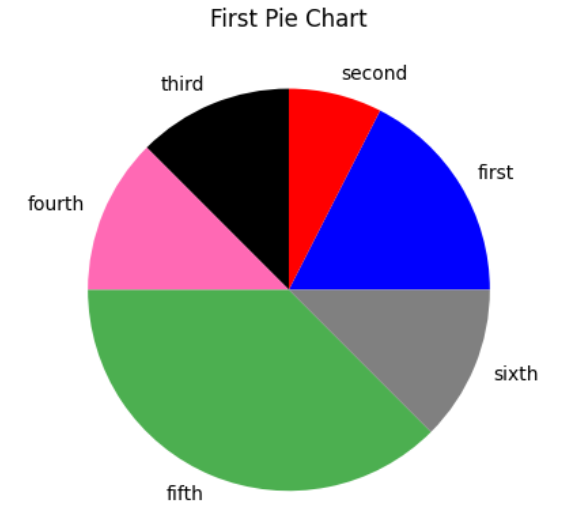
- We can also give different colors to our chart by color parameter:
color = ['blue','red','black','hotpink','#4CAF50','grey']
plt.pie(y, labels = L, colors = color)
Output:
Legend
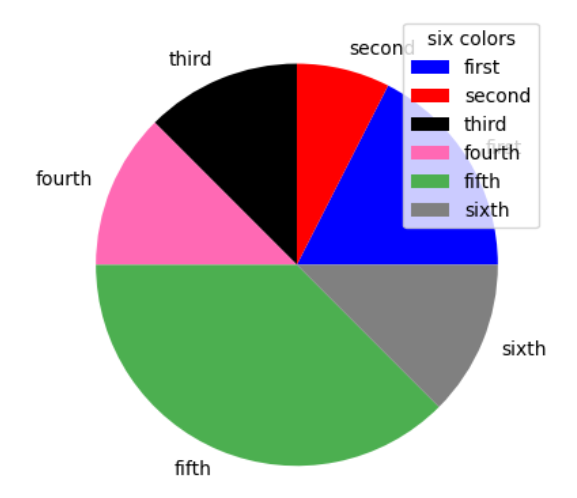
- In the Pie chart, we can also add a list of explanations for each region (wedge).
- For this, we use legend() function.
plt.legend()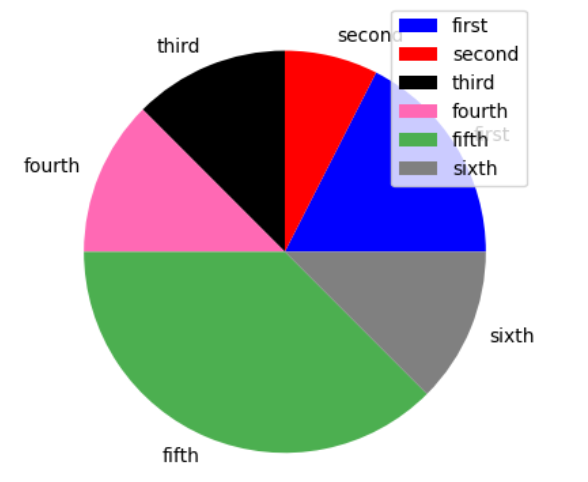
-
We can also give our legend a header.
plt.legend(title='six colors')