Credit Business Overview
Dashboard Title: Credit Business Overview
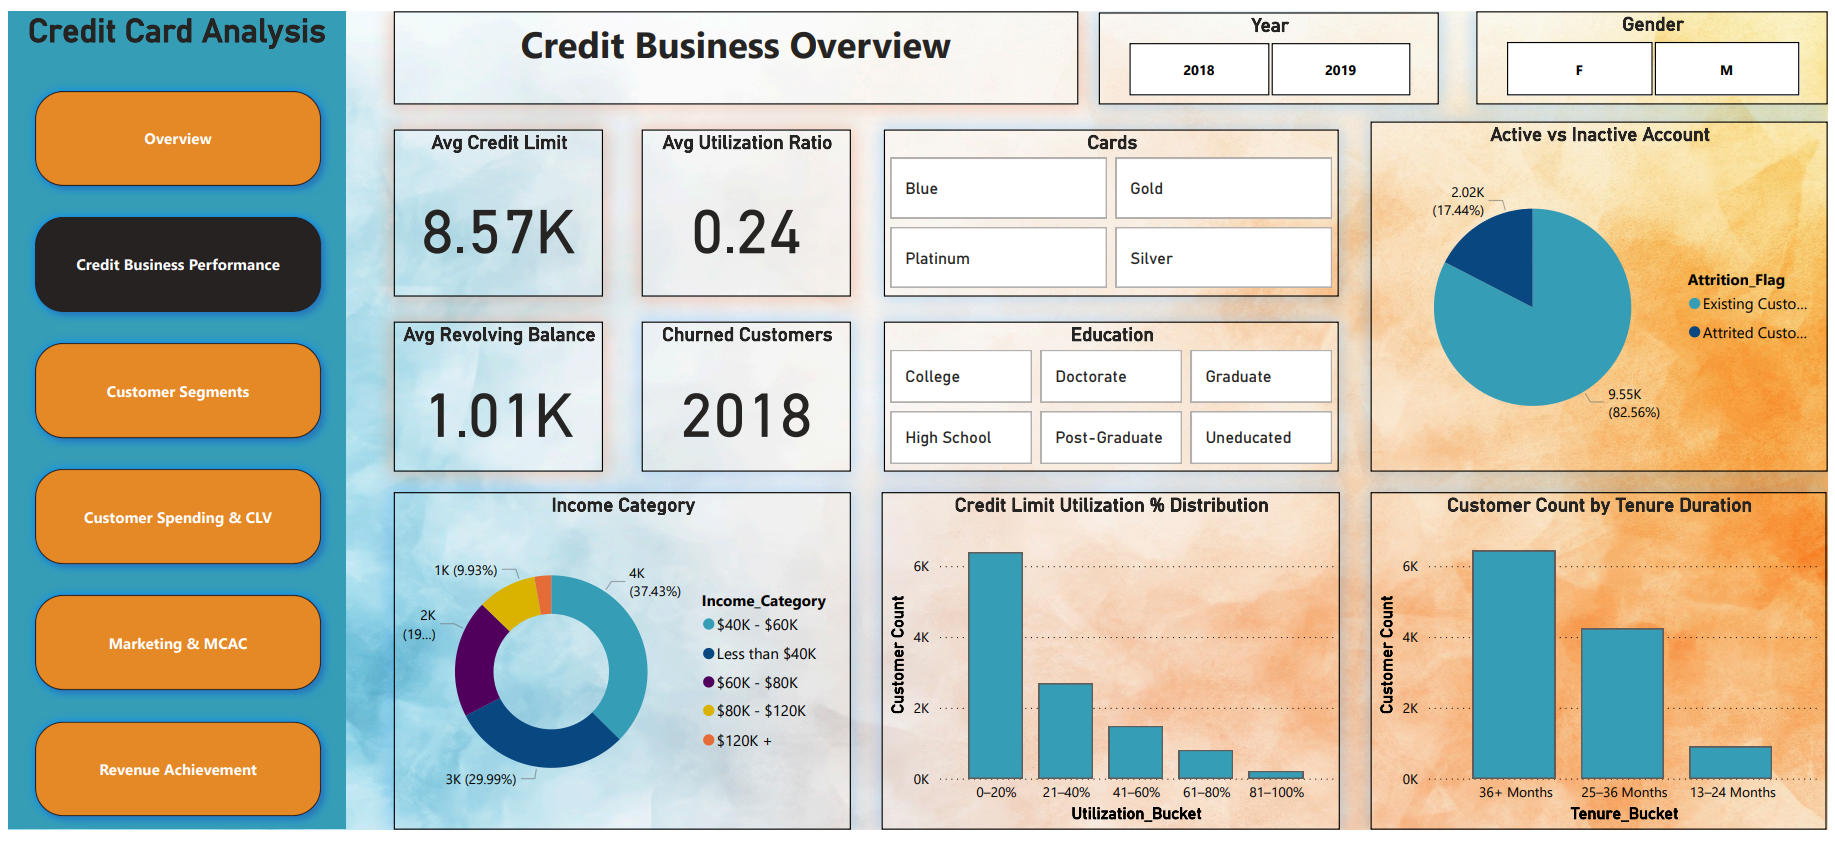
This dashboard focuses on providing deep insights into customer profiles, credit card usage behavior, and account statuses. It is essential for understanding customer demographics, financial habits, and trends within the credit card business.
Section-wise Breakdown of the Dashboard Visuals
1. KPI Cards – Customer Usage Metrics
These top-level metrics help quickly assess customer financial behavior.
|
KPI |
Value |
Description |
|---|---|---|
|
Avg Credit Limit |
₹8.57K |
Average credit assigned to each customer. |
|
Avg Utilization Ratio |
0.24 |
On average, customers use 24% of their available credit — indicates moderate credit use. |
|
Avg Revolving Balance |
₹1.01K |
The average unpaid balance that gets carried to the next billing cycle. |
|
Churned Customers |
2,018 |
Number of customers who have stopped using the credit service during the period. |
These indicators are crucial to assess customer engagement and financial responsibility.
2. Pie Chart – Active vs Inactive Accounts
-
Active Customers: 82.56%
-
Churned (Attrited) Customers: 17.44%
Insight:
This visualization reveals the proportion of retained versus lost customers, helping evaluate customer satisfaction and retention strategies.
3. Card Type Distribution
Categories: Blue, Gold, Platinum, Silver
Insight:
This chart shows the popularity of different card types. It can inform product improvement strategies or marketing focus areas based on customer preferences.
4. Education Breakdown
Categories Include:
-
College
-
Graduate
-
Post-Graduate
-
Doctorate
Insight:
Understanding customer education levels gives clues about likely income levels and financial behavior, enabling more precise targeting and segmentation.
5. Pie Chart – Income Category Distribution
Key Groups:
-
$40K–$60K: Largest segment at 37.43%
-
Other groups include <$40K, $60K–$80K, etc.
Insight:
Income level distribution is essential for risk assessment and marketing campaigns. The largest group ($40K–$60K) represents a middle-income segment — ideal for tailored financial products.
6. Bar Chart – Credit Limit Utilization % Distribution
Insight:
Most customers fall into the 0–20% utilization bracket. This indicates responsible credit behavior, but also shows that the company could consider strategies to increase engagement and usage.
High utilization can indicate risk; low utilization can mean under-engagement.
7. Bar Chart – Customer Tenure Distribution
Insight:
Shows how long customers have been with the company. The majority are long-term users with tenures of 36+ months, indicating high customer loyalty and product satisfaction.
Purpose of the Dashboard
The Credit Business Overview Dashboard is built to:
-
Profile customers based on behavior and demographics
-
Analyze credit utilization trends
-
Understand churn and loyalty patterns
-
Support smarter risk management and product planning
Objective: Help businesses understand who their customers are, how they use their credit, and how to retain them effectively.