Customer Segmentation
Dashboard Title: Customer Segmentation
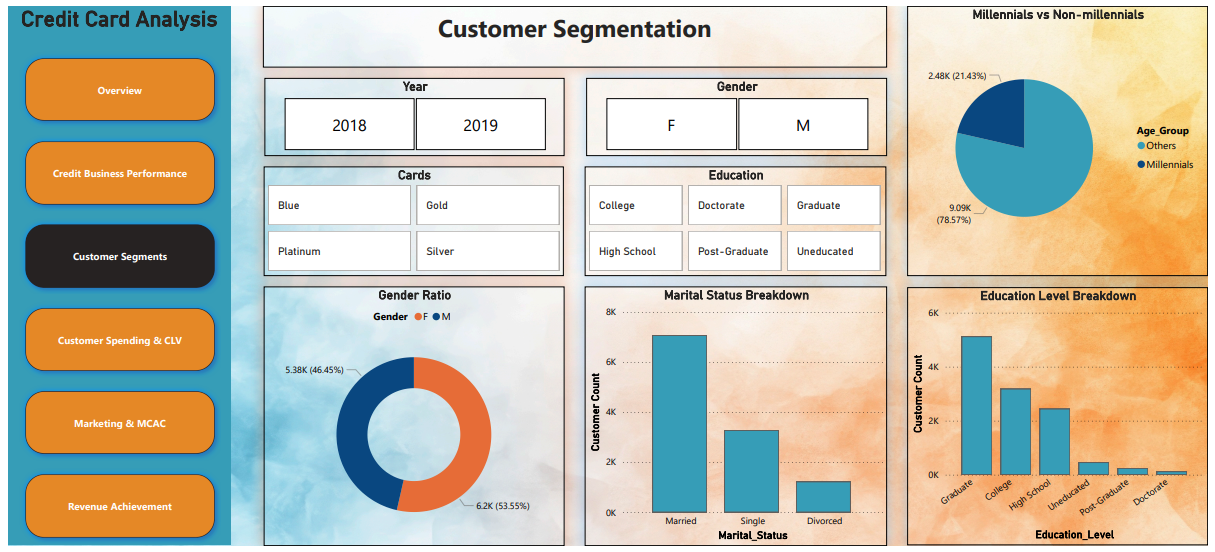
This dashboard is designed to give a demographic-based breakdown of credit card customers. It helps stakeholders understand which customer groups are most active and where opportunities lie for targeted marketing and improved service personalization.
Section-wise Breakdown of the Dashboard Visuals
1. Gender Ratio – Donut Chart
|
Gender |
Percentage |
Count |
|---|---|---|
|
Male |
53.55% |
6.2K |
|
Female |
46.45% |
5.38K |
Insight:
There is a fairly balanced distribution between male and female customers. This balance creates an excellent opportunity for gender-targeted campaigns (e.g., product bundles or rewards tailored for each segment).
2. Millennials vs Non-Millennials – Pie Chart
|
Age Group |
Percentage |
Count |
|---|---|---|
|
Millennials |
21.43% |
2.48K |
|
Non-Millennials |
78.57% |
9.09K |
Insight:
A large share of the customer base is made up of non-millennials. This indicates a mature audience and provides a growth opportunity to attract younger users through digital-first offerings, rewards, and partnerships that appeal to millennial lifestyles.
3. Marital Status Breakdown – Bar Chart
Customer Segments:
-
Married: Largest segment (~7K+)
-
Single: Second-largest
-
Divorced: Smaller proportion
Insight:
Marital status affects spending behavior and financial needs. For example:
-
Married users may prefer family-oriented benefits.
-
Single users may be more inclined toward travel and entertainment perks.
-
Understanding this helps design lifestyle-appropriate product features.
4. Education Level Breakdown – Bar Chart
Customer Segments:
-
Graduate: Largest group (~5K+)
-
Followed by College, High School, and other categories.
Insight:
Education level is closely tied to income potential and financial awareness. More educated users may respond well to:
-
Sophisticated financial tools
-
Long-term credit products
-
Investment-linked rewards
This data can also aid in creditworthiness evaluation.
5. Filter Options – Interactive Dashboard Controls
Available Filters:
-
Year: Compare 2018 vs 2019 performance or shifts in customer patterns.
-
Gender
-
Card Type
-
Education
Insight:
Filters allow analysts to drill down into specific cohorts and monitor trends. For instance:
-
Did male millennials prefer platinum cards in 2019?
-
Has the education profile of customers changed over time?
Filters improve data exploration and personalized analysis.
Purpose of the Dashboard
This dashboard is created to:
-
Segment the customer base based on gender, age group, marital status, and education level.
-
Identify dominant customer types and their characteristics.
-
Support tailored marketing, customer service improvements, and credit risk profiling.
Goal: Use demographic insights to improve engagement, increase customer satisfaction, and reduce attrition through data-driven personalization.