Revenue Achievement
Dashboard Title: Revenue Achievement
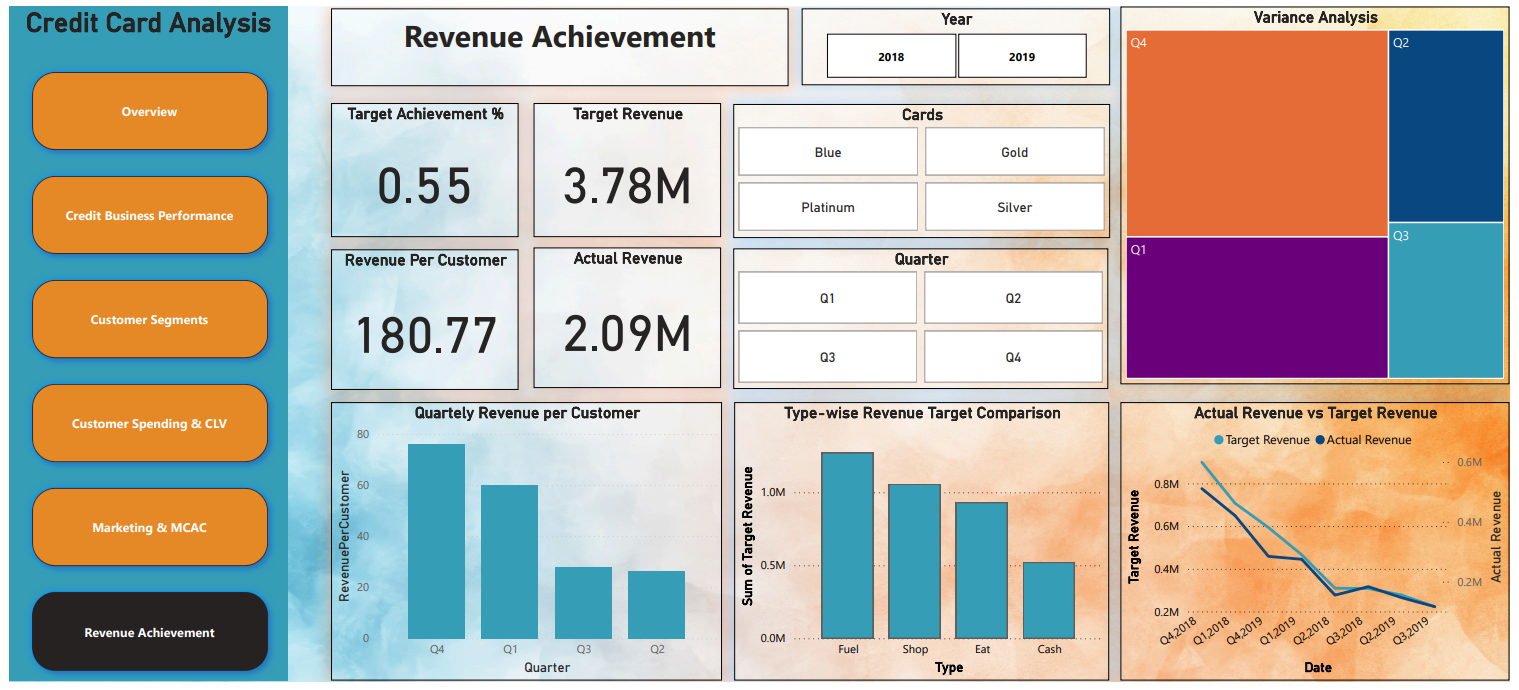
This dashboard provides a comprehensive overview of how well revenue targets were achieved over time, across card types, and by transaction categories. It helps stakeholders identify shortfalls, successful periods, and areas that require improvement.
Section-wise Breakdown of Visualizations
1. Key Metrics – Summary of Revenue Performance
|
Metric |
Value |
|---|---|
|
Target Achievement |
55% |
|
Target Revenue |
₹3.78M |
|
Actual Revenue |
₹2.09M |
|
Revenue per Customer |
₹180.77 |
Insight:
-
Only 55% of the revenue target was achieved – this highlights a major underperformance.
-
The revenue per customer is ₹180.77, providing a benchmark for future customer-level goals.
Action Point: Investigate reasons for the 45% shortfall and evaluate marketing or sales initiatives accordingly.
2. Treemap – Variance Analysis by Quarter
-
Q1 and Q4 showed the highest revenue gaps (largest shortfalls).
-
The treemap layout makes it easy to compare the variance across quarters at a glance.
Insight:
Focus on improving performance in Q1 and Q4, which likely had high expectations but didn’t meet targets.
Usage: Useful for quarterly performance reviews and planning corrective actions.
3. Bar Chart – Quarterly Revenue Per Customer
|
Quarter |
Revenue per Customer |
|---|---|
|
Q4 |
~₹80 |
|
Q1 |
Moderate |
|
Q2 |
Low |
|
Q3 |
Low |
Insight:
-
Q4 stands out for highest revenue per customer, indicating strong engagement or high-value transactions.
-
Q2 and Q3 show relatively weaker customer performance.
Focus Area: Understand what worked in Q4 to replicate that strategy in weaker quarters.
4. Bar Chart – Revenue by Transaction Type
|
Type |
Contribution to Target |
|---|---|
|
Fuel |
High |
|
Shop |
High |
|
Cash |
Lowest |
Insight:
-
Fuel and Shopping transactions are driving revenue.
-
Cash transactions contribute the least.
Strategy Tip: Promote usage in high-contributing areas (Fuel/Shop) and re-evaluate incentives for cash use.
5. Line Chart – Actual vs Target Revenue Over Time
-
Strong performance until Q4 2018, then a dip starts.
-
Throughout 2019, actual revenue remains consistently below the target.
Insight:
There is a clear downward trend in performance post-2018, indicating potential market, economic, or internal strategic issues.
Takeaway: An in-depth review of 2019 initiatives is needed to realign the strategy.
6. Filter Options – Custom Analysis Capabilities
-
Year: 2018 or 2019
-
Card Type: Blue, Gold, Platinum, Silver
-
Quarter: Q1, Q2, Q3, Q4
Purpose:
-
Allows detailed drill-downs by year, card type, or quarter to analyze which segments were underperforming or succeeding.
-
Use Case: For example, filter by Platinum cards in Q4 2019 to understand their specific performance.
Key Insights
-
Only 55% of the total revenue target was met.
-
Q1 and Q4 had the largest gaps in target achievement.
-
Fuel and Shop transaction types were the most lucrative.
-
A steady decline in revenue performance started post-2018 and continued through 2019.
Purpose of the Dashboard
This dashboard helps business and marketing teams:
- Track revenue performance against targets
- Identify weak quarters or segments
- Plan targeted campaigns for underperforming categories
- Align revenue strategies with customer behavior and spending trends