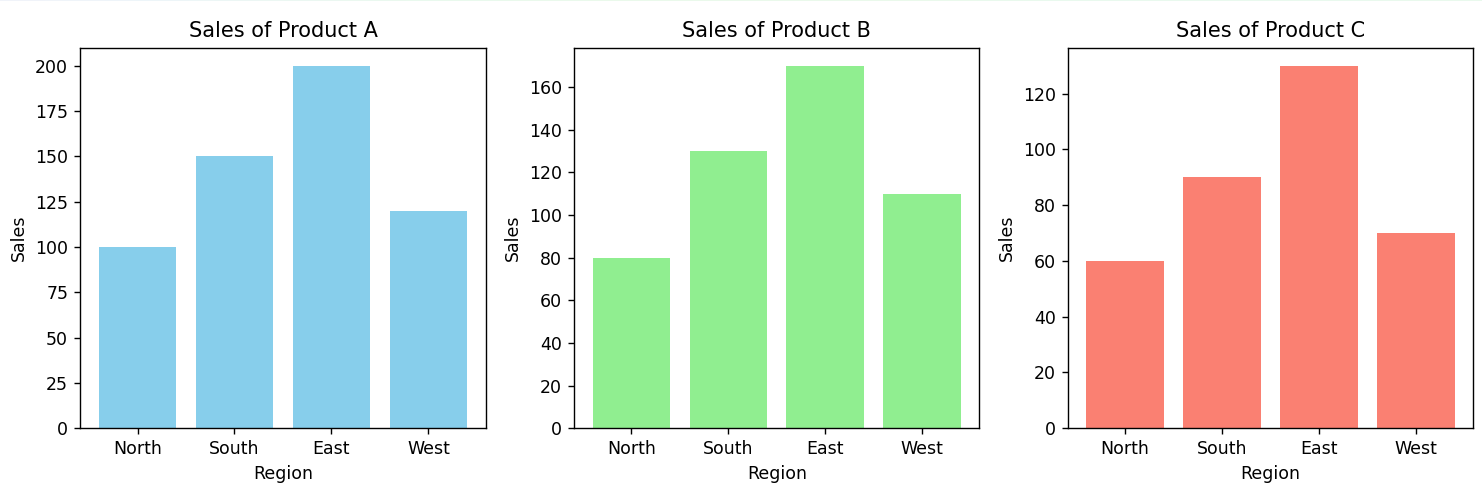
Description:
This program uses subplots to create multiple smaller plots within the same figure. Each subplot will show sales data for a different region, making it easy to compare the sales across regions side by side.
Code Explanation:
subplots() creates multiple small plots in one figure.
Each subplot shows sales data for a specific region.
Helps in side-by-side comparison.
Titles, labels, and grids make each plot more readable.
tight_layout() adjusts spacing between subplots.
show() displays all the subplots together.
Program:
import matplotlib.pyplot as plt

# Sales data for different regions
regions = ['North', 'South', 'East', 'West']
sales_A = [100, 150, 200, 120]  # Sales for Product A
sales_B = [80, 130, 170, 110]   # Sales for Product B
sales_C = [60, 90, 130, 70]     # Sales for Product C

# Create subplots
fig, axes = plt.subplots(1, 3, figsize=(12, 4))

# Plot sales data for Product A in the first subplot
axes[0].bar(regions, sales_A, color='skyblue')
axes[0].set_title('Sales of Product A')
axes[0].set_xlabel('Region')
axes[0].set_ylabel('Sales')

# Plot sales data for Product B in the second subplot
axes[1].bar(regions, sales_B, color='lightgreen')
axes[1].set_title('Sales of Product B')
axes[1].set_xlabel('Region')
axes[1].set_ylabel('Sales')

# Plot sales data for Product C in the third subplot
axes[2].bar(regions, sales_C, color='salmon')
axes[2].set_title('Sales of Product C')
axes[2].set_xlabel('Region')
axes[2].set_ylabel('Sales')

# Adjust layout to prevent overlap
plt.tight_layout()

# Show the plot
plt.show()
Output:


Trainings :
UI UX Design Training in Indore | DevOps Training in Indore | Python + DSA Training in Indore | Python and Django Training in Indore | Full Stack Development Training in Indore | Data Analytics Training in Indore | Data Science Training in Indore | Web Development Training in Indore |Free Courses and Resource :
Verbal Aptitude | Matplotlib Tutorials | Examples | Interview Questions | Pandas Tutorials | Projects | Interview Questions | OpenCV Tutorials | Projects | Interview Questions | ExpressJS Tutorials | Projects | Interview Questions | Dart | Python Data Structures and Algorithms | Rust Tutorials | Projects | Interview Questions | Aptitude Tests | HackerRank Python | Django | MongoDB Tutorials | Examples | Interview Questions | NumPy Practice Questions | Python Tutorials by CodersDaily | Golang Tutorials | Projects | Interview Questions | React.js Tutorials | Verbal Ability Tutorial | MS Sql Server Tutorials | Examples | Interview Questions | Power BI Tutorials | Projects | Interview Questions | Example Dashboards | Numpy Tutorials | Projects | Interview Questions | Django REST Framework Tutorial | HackerRank C++ Solutions | Pandas Practice Questions | Tensor Flow | Python Practice Questions | C++ Tutorials | Quantitative Ability Tutorial | Google Sheets Mastery: From Basics to Dashboards | Langchain Tutorials | Javascript | Node.js Tutorials | HackerRank SQL Solutions | HackerRank DSA Solutions | Verbal Aptitude 2 | HackerRank Java Solutions | HTML Tutorial | TCS NQT Mock Test Series | Reasoning Ability Tutorial | CodeChef Python Solutions | HackerRank C Program Solutions | Leetcode Python Solutions | SQL Practice Question | Matplotlib Practice Questions |Interview Questions :
Pandas Tutorials | Projects | Interview Questions | ExpressJS Tutorials | Projects | Interview Questions | Django | Python Tutorials by CodersDaily | Golang Tutorials | Projects | Interview Questions | Numpy Tutorials | Projects | Interview Questions | Django REST Framework Tutorial | Matplotlib Practice Questions | Matplotlib Practice Questions | Matplotlib Practice Questions | Matplotlib Practice Questions | Matplotlib Practice Questions | Matplotlib Practice Questions | Matplotlib Practice Questions | Matplotlib Practice Questions | Matplotlib Practice Questions | Matplotlib Practice Questions |Top Colleges in India :
Indian Institute of Technology Bombay | Jaypee University of Engineering and Technology - Guna |