Add Interactive Tooltips Using Mplcursors
Description:
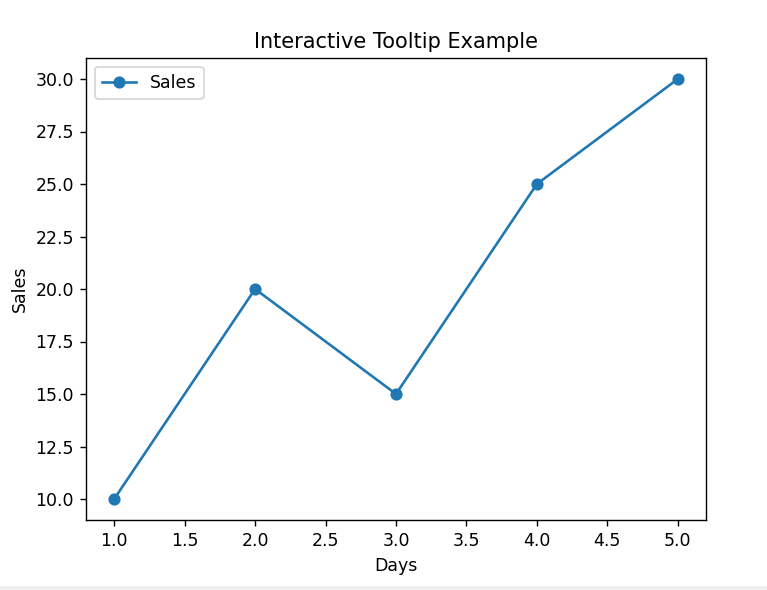
This program creates a line chart and adds interactive tooltips using the mplcursors library, which shows exact data values when you hover over points.
Code Explanation:
-
matplotlib.pyplotis used to create the plot. -
mplcursorsis a tool that lets you see data values when you move your mouse over the chart. -
xandystore values for the chart (e.g., Days and Sales). -
plot()draws the line chart andmarker='o'adds visible points. -
cursor = mplcursors.cursor()enables interactivity. -
When you hover on a point, it shows a small label like "Day 2 — Sales: 20".
-
show()displays the interactive chart.
Program:
import matplotlib.pyplot as plt
import mplcursors

# Sample data
x = [1, 2, 3, 4, 5]
y = [10, 20, 15, 25, 30]

# Plotting the line
plt.plot(x, y, marker='o', label='Sales')

# Title and labels
plt.title("Interactive Tooltip Example")
plt.xlabel("Days")
plt.ylabel("Sales")

# Show legend
plt.legend()

# Enable interactive tooltips
cursor = mplcursors.cursor(hover=True)
cursor.connect("add", lambda sel: sel.annotation.set_text(f"Day {x[sel.index]}\nSales: {y[sel.index]}"))

# Show plot
plt.show()
Output: