Apply Style Themes like 'ggplot', 'seaborn'
Description:
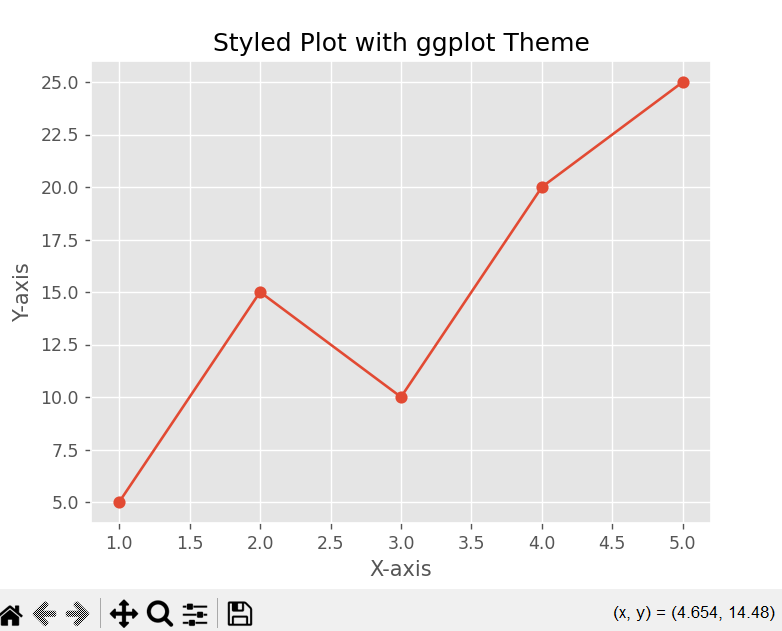
This program applies a predefined style theme (like 'ggplot') to a line plot, changing the chart's look automatically.
Code Explanation:
-
matplotlib.pyplotis used for plotting. -
plt.style.use('ggplot')changes the overall look of the chart:-
It automatically sets colors, grid style, background, fonts, etc.
-
-
You can use other themes too:
-
'seaborn','bmh','fivethirtyeight','classic','dark_background', etc.
-
-
The rest of the code plots a simple line chart with labels and markers.
-
plt.show()displays the chart using the selected style.
Program:
import matplotlib.pyplot as plt

# Apply a style theme
plt.style.use('ggplot')  # Try 'seaborn', 'fivethirtyeight', 'bmh', etc.

# Sample data
x = [1, 2, 3, 4, 5]
y = [5, 15, 10, 20, 25]

# Create plot
plt.plot(x, y, marker='o')
plt.title('Styled Plot with ggplot Theme')
plt.xlabel('X-axis')
plt.ylabel('Y-axis')

# Show the plot
plt.show()
Output: