Animate a Bar Chart Race Using matplotlib.animation
Description:
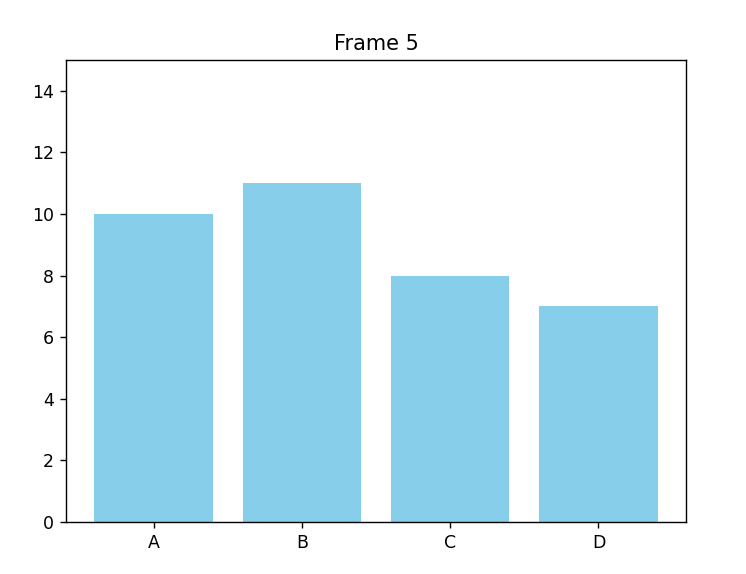
This program creates an animated bar chart (bar chart race) where bar heights change over time using matplotlib.animation.FuncAnimation.
Explanation:
-
matplotlib.pyplotis used for plotting, andmatplotlib.animationis used for animation. -
categoriesare the labels of bars (e.g., products or countries). -
values_over_timeholds bar heights for each time frame. -
ax.bar()creates the initial bars. -
update()is a function that changes bar heights for each frame of animation. -
FuncAnimation()runs the update function again and again to animate the chart. -
interval=1000sets the speed (1000ms = 1 second per frame). -
show()displays the animated chart.
Program:
import matplotlib.pyplot as plt
import matplotlib.animation as animation
import numpy as np

# Sample data for 5 frames (e.g., years or months)
categories = ['A', 'B', 'C', 'D']
values_over_time = [
    [5, 7, 6, 3],
    [6, 8, 5, 4],
    [7, 9, 6, 5],
    [8, 10, 7, 6],
    [10, 11, 8, 7]
]

fig, ax = plt.subplots()
bars = ax.bar(categories, values_over_time[0], color='skyblue')
ax.set_ylim(0, 15)
ax.set_title("Bar Chart Race Animation")

def update(frame):
    for bar, new_height in zip(bars, values_over_time[frame]):
        bar.set_height(new_height)
    ax.set_title(f"Frame {frame + 1}")

ani = animation.FuncAnimation(fig, update, frames=len(values_over_time), repeat=False, interval=1000)

plt.show()
Output: