Plot Multiple Lines on the Same Chart
Description:
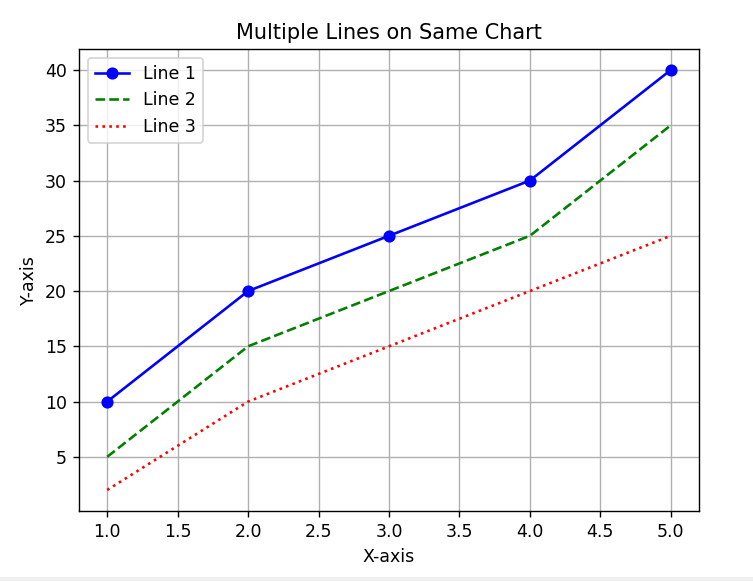
This program plots multiple lines on the same chart with different styles and labels to compare datasets effectively.
Code Explanation:
-
matplotlib.pyplotis used to draw the chart. -
Lists for X and Y values are created to represent data.
-
plot()function is used multiple times to draw multiple lines. -
Each line has different color, style, and label to differentiate.
-
legend()shows which line represents what. -
grid(True)adds background lines for better readability. -
show()displays the final chart.
Program:
import matplotlib.pyplot as plt

# Sample data for 3 lines
x = [1, 2, 3, 4, 5]
y1 = [10, 20, 25, 30, 40]     # Line 1
y2 = [5, 15, 20, 25, 35]      # Line 2
y3 = [2, 10, 15, 20, 25]      # Line 3

# Plotting the lines
plt.plot(x, y1, label='Line 1', color='blue', marker='o')
plt.plot(x, y2, label='Line 2', color='green', linestyle='--')
plt.plot(x, y3, label='Line 3', color='red', linestyle=':')

# Adding titles and labels
plt.title('Multiple Lines on Same Chart')
plt.xlabel('X-axis')
plt.ylabel('Y-axis')

# Show legend
plt.legend()

# Show grid
plt.grid(True)

# Show the plot
plt.show()
Output: