Save a Figure to File in PNG and PDF Formats
Description:
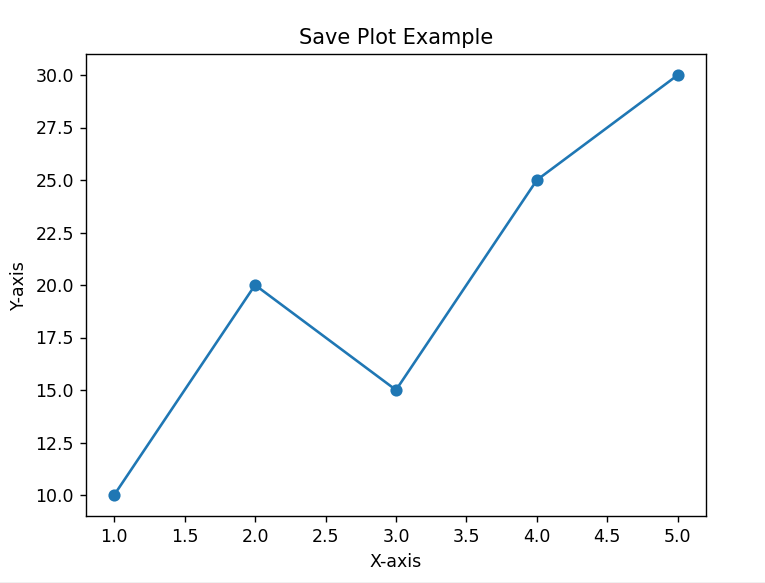
This program creates a simple line plot and saves it to your computer in both PNG and PDF formats using plt.savefig().
Code Explanation:
-
matplotlib.pyplotis used to create the plot. -
xandydata are used to draw the line chart with circular markers. -
plt.title(),xlabel(), andylabel()are used to label the chart. -
plt.savefig('filename.format')saves the chart to your system:-
'plot_output.png'saves as an image. -
'plot_output.pdf'saves as a high-quality PDF.
-
-
plt.show()displays the plot on screen.
Program:
import matplotlib.pyplot as plt

# Sample data
x = [1, 2, 3, 4, 5]
y = [10, 20, 15, 25, 30]

# Create line plot
plt.plot(x, y, marker='o')
plt.title('Save Plot Example')
plt.xlabel('X-axis')
plt.ylabel('Y-axis')

# Save the figure as PNG and PDF
plt.savefig('plot_output.png')   # Saves in PNG format
plt.savefig('plot_output.pdf')   # Saves in PDF format

# Show the plot
plt.show()
Output: