Create a Heatmap from Pivoted Sales Data
Description:
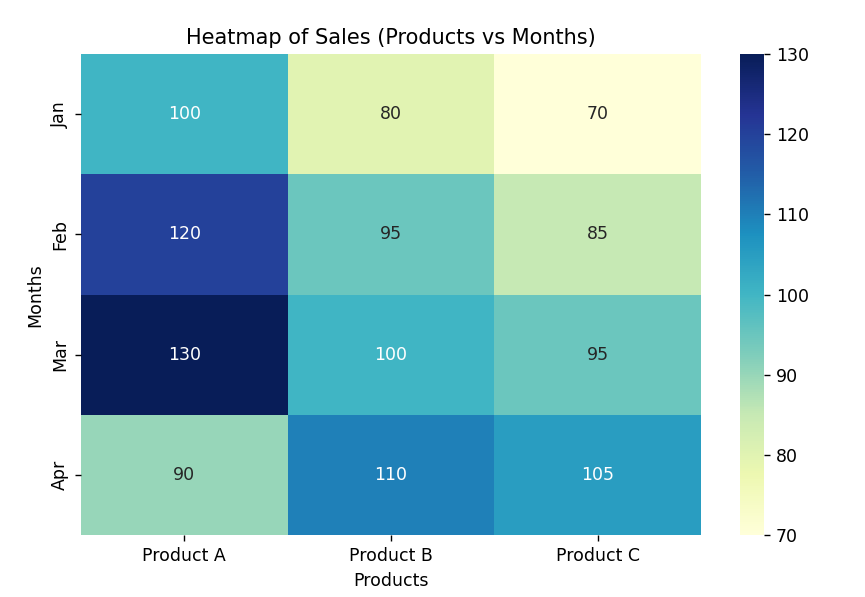
This program creates a heatmap using pivoted sales data. A heatmap visually represents data using colors, where darker or lighter shades indicate higher or lower values.
Code Explanation:
-
seaborn.heatmap()is used to draw color-coded matrix. -
Darker/lighter colors show higher/lower values.
-
X and Y axes usually represent categories and time.
-
Best for spotting trends, highs, and lows quickly.
Program:
import matplotlib.pyplot as plt
import seaborn as sns
import pandas as pd

# Sample pivoted sales data (e.g., months vs products)
data = {
    'Product A': [100, 120, 130, 90],
    'Product B': [80, 95, 100, 110],
    'Product C': [70, 85, 95, 105]
}
index_labels = ['Jan', 'Feb', 'Mar', 'Apr']
sales_df = pd.DataFrame(data, index=index_labels)

# Create heatmap
plt.figure(figsize=(8, 5))
sns.heatmap(sales_df, annot=True, cmap='YlGnBu', fmt='d')

# Add title
plt.title('Heatmap of Sales (Products vs Months)')
plt.xlabel('Products')
plt.ylabel('Months')

# Show plot
plt.show()
Output: