Add export date as a footer on plot
Description:
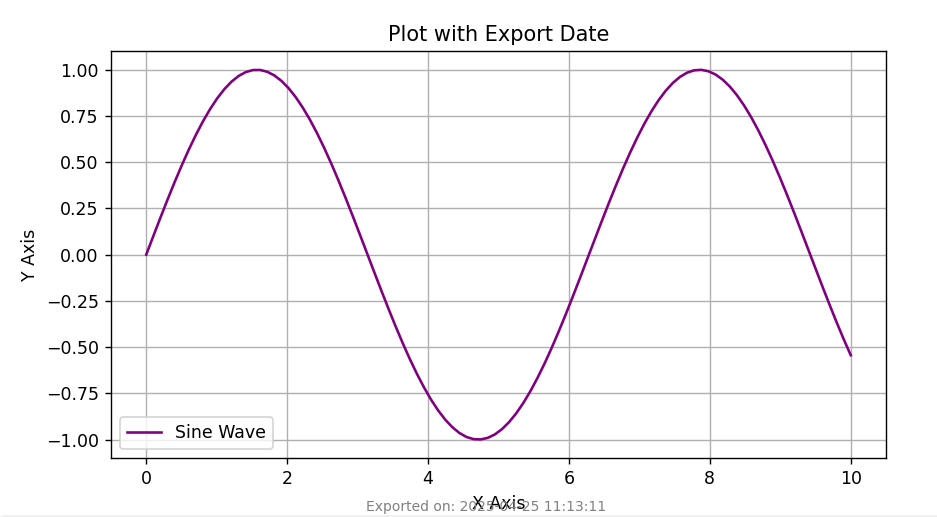
This code adds the current export date as a footer on the plot using matplotlib, helping track when the plot was generated or exported.
Code Explanation:
-
We first import matplotlib and Python’s datetime module.
-
We create sample data and plot it with
plt.plot(). -
We get the current date using
datetime.now()and format it nicely. -
The date is then added as a footer using
plt.figtext()at the bottom of the figure. -
Finally, we display or save the plot, now with a timestamp at the bottom.
-
This helps keep a record of the plot creation/export date for documentation or reports.
Program:
import matplotlib.pyplot as plt
import numpy as np
from datetime import datetime

# Sample data
x = np.linspace(0, 10, 100)
y = np.sin(x)

# Create the plot
plt.figure(figsize=(8, 4))
plt.plot(x, y, label='Sine Wave', color='purple')
plt.title('Plot with Export Date')
plt.xlabel('X Axis')
plt.ylabel('Y Axis')
plt.legend()
plt.grid(True)

# Add current date as a footer
export_date = datetime.now().strftime("Exported on: %Y-%m-%d %H:%M:%S")
plt.figtext(0.5, 0.01, export_date, ha='center', fontsize=8, color='gray')

# Show the plot
plt.show()

# Optional: Save with date footer
# plt.savefig("plot_with_date_footer.png", dpi=300, bbox_inches='tight')
Output: