Adjust Spacing Between Subplots
Description:
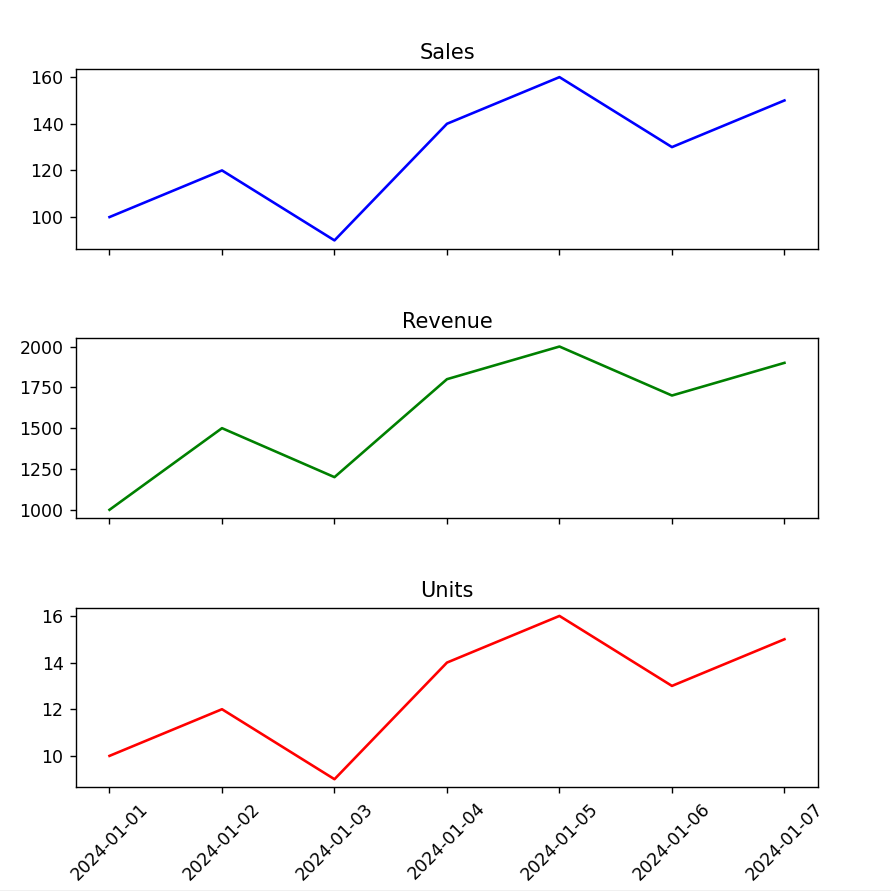
This code shows how to use plt.subplots_adjust() to control the spacing between multiple subplots — both vertically and horizontally.
Code Explanation:
-
plt.subplots_adjust(hspace=0.5)adds space between rows (height-wise). -
You can also use
wspaceto adjust width-wise space between columns if you have multiple columns. -
This is helpful when titles or labels are overlapping.
Program:
import matplotlib.pyplot as plt
import pandas as pd

# Sample data
data = {
    'Date': pd.date_range(start='2024-01-01', periods=7, freq='D'),
    'Sales': [100, 120, 90, 140, 160, 130, 150],
    'Revenue': [1000, 1500, 1200, 1800, 2000, 1700, 1900],
    'Units': [10, 12, 9, 14, 16, 13, 15]
}
df = pd.DataFrame(data)

# Create subplots
fig, axs = plt.subplots(3, 1, figsize=(10, 8), sharex=True)

# Plot data
axs[0].plot(df['Date'], df['Sales'], color='blue', label='Sales')
axs[1].plot(df['Date'], df['Revenue'], color='green', label='Revenue')
axs[2].plot(df['Date'], df['Units'], color='red', label='Units')

# Titles for each subplot
axs[0].set_title('Sales')
axs[1].set_title('Revenue')
axs[2].set_title('Units')

# Rotate x-axis labels
plt.xticks(rotation=45)

# Adjust spacing between subplots
plt.subplots_adjust(hspace=0.5)  # Increase vertical space between plots

# Show plot
plt.show()
Output: