Use LaTeX in Axis Labels
Description:
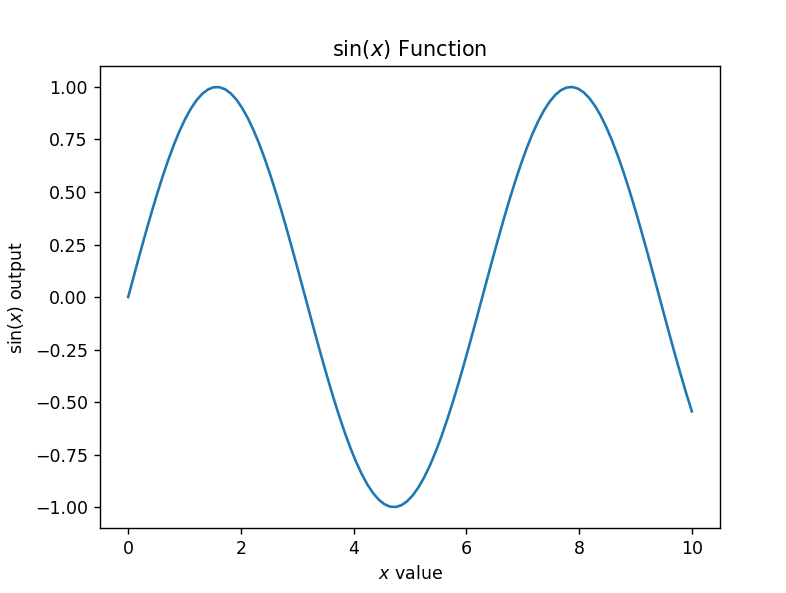
This program uses LaTeX syntax in titles and axis labels to display mathematical notation such as sine functions or symbols like Greek letters.
Explanation:
-
The
r'...'before a string tells Python to treat it as a raw string, which is needed for LaTeX formatting. -
Inside the quotes, LaTeX code like
$\sin(x)$is used to show:-
Mathematical expressions (like sine, exponents, fractions)
-
Symbols (Greek letters like
$\alpha$, $\beta$)
-
-
This makes your plot more professional and suitable for scientific presentations or reports.
-
plt.title(),xlabel(), andylabel()support LaTeX directly in Matplotlib.
Program:
import matplotlib.pyplot as plt
import numpy as np

# Sample data
x = np.linspace(0, 10, 100)
y = np.sin(x)

# Create the plot
plt.plot(x, y)

# Use LaTeX in axis labels and title
plt.title(r'$\sin(x)$ Function')
plt.xlabel(r'$x$ value')
plt.ylabel(r'$\sin(x)$ output')

# Show the plot
plt.show()
Output: