Plot 3D Surfaces Using Axes3D
Description:
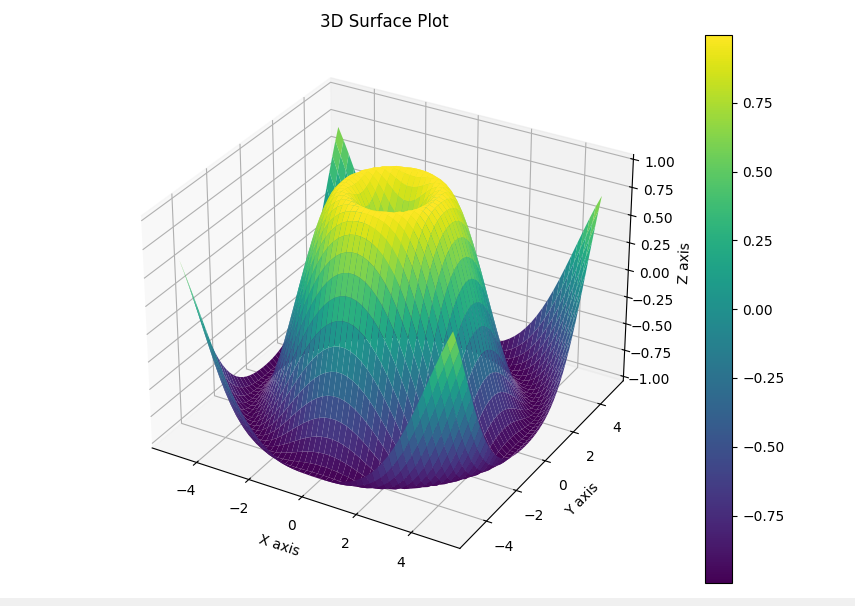
A Python program that plots a 3D surface using Axes3D from mpl_toolkits.mplot3d to visualize mathematical functions in three dimensions.
Code Explanation:
● import numpy as np: Used to generate grid and mathematical data.
● import matplotlib.pyplot as plt: Required to plot the figure.
● from mpl_toolkits.mplot3d import Axes3D: Imports the 3D plotting toolkit from Matplotlib.
● np.linspace(-5, 5, 50): Creates evenly spaced values for x and y between -5 and 5.
● np.meshgrid(x, y): Creates a 2D grid for plotting the 3D surface.
● z = np.sin(np.sqrt(x**2 + y**2)): Calculates z-values using a mathematical function.
● fig.add_subplot(111, projection='3d'): Adds a 3D subplot to the figure.
● ax.plot_surface(...): Plots the 3D surface using the computed x, y, and z values.
● cmap='viridis': Sets the colormap for the surface.
● fig.colorbar(surface): Adds a color bar indicating value levels.
● Axis titles and labels are set for clarity.
Program:
import numpy as np
import matplotlib.pyplot as plt
from mpl_toolkits.mplot3d import Axes3D

# Create a grid of x and y values
x = np.linspace(-5, 5, 50)
y = np.linspace(-5, 5, 50)
x, y = np.meshgrid(x, y)

# Compute the z values based on a function
z = np.sin(np.sqrt(x**2 + y**2))

# Create a 3D plot
fig = plt.figure(figsize=(8, 6))
ax = fig.add_subplot(111, projection='3d')

# Plot the surface
surface = ax.plot_surface(x, y, z, cmap='viridis')

# Add color bar
fig.colorbar(surface)

# Set labels
ax.set_title("3D Surface Plot")
ax.set_xlabel("X axis")
ax.set_ylabel("Y axis")
ax.set_zlabel("Z axis")

# Show the plot
plt.tight_layout()
plt.show()
Output: