Save multiple plots to one PDF
Description:
This code saves multiple plots into a single multi-page PDF file using matplotlib.backends.backend_pdf.PdfPages.
Code Explanation:
-
First, we import matplotlib and PdfPages from its
backendsmodule. -
We use
PdfPages()to open/create a multi-page PDF file. -
We create multiple figures/plots using
plt.figure()andplt.plot(). -
After each plot, we save the current figure to the PDF using
pdf.savefig(). -
Finally, we close the PDF file with
pdf.close()to finish writing. -
This is useful when you want to compile several charts into a single report or document.
Program:
import matplotlib.pyplot as plt
import numpy as np
from matplotlib.backends.backend_pdf import PdfPages
# Create a PdfPages object to save multiple plots
with PdfPages("multiple_plots.pdf") as pdf:
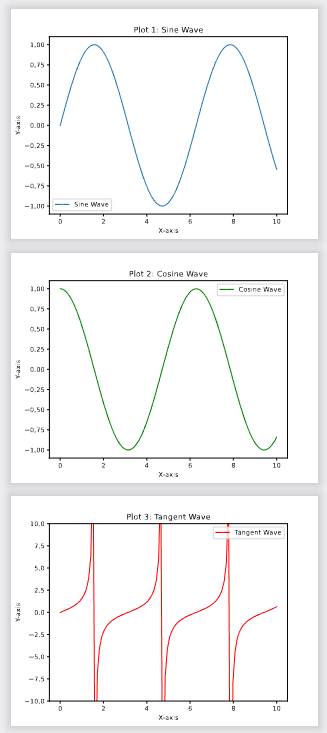
# First plot
x = np.linspace(0, 10, 100)
y1 = np.sin(x)
plt.figure()
plt.plot(x, y1, label='Sine Wave')
plt.title("Plot 1: Sine Wave")
plt.xlabel("X-axis")
plt.ylabel("Y-axis")
plt.legend()
pdf.savefig() # Save current figure to PDF
plt.close()
# Second plot
y2 = np.cos(x)
plt.figure()
plt.plot(x, y2, label='Cosine Wave', color='green')
plt.title("Plot 2: Cosine Wave")
plt.xlabel("X-axis")
plt.ylabel("Y-axis")
plt.legend()
pdf.savefig()
plt.close()
# Third plot
y3 = np.tan(x)
plt.figure()
plt.plot(x, y3, label='Tangent Wave', color='red')
plt.title("Plot 3: Tangent Wave")
plt.xlabel("X-axis")
plt.ylabel("Y-axis")
plt.ylim(-10, 10) # Limit y-axis to avoid extreme values
plt.legend()
pdf.savefig()
plt.close()
Output: