Use tight_layout() to Fix Overlapping Text
Description:
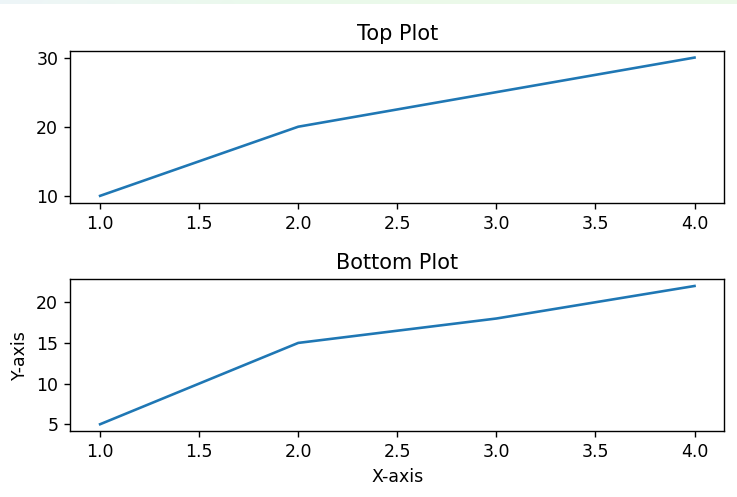
This code creates two subplots and uses tight_layout() to automatically adjust spacing so that titles, labels, and axes don't overlap.
Explanation:
-
When you use multiple plots or large labels, the elements might overlap.
-
plt.tight_layout()automatically adjusts the padding between subplots to make sure:-
Titles
-
Axis labels
-
Ticks
don't run into each other or get cut off.
-
-
It improves readability and appearance of the plot without manual adjustments.
Program:
import matplotlib.pyplot as plt

# Create multiple subplots
fig, axs = plt.subplots(2, 1, figsize=(6, 4))

# Sample data
x = [1, 2, 3, 4]
y1 = [10, 20, 25, 30]
y2 = [5, 15, 18, 22]

# Plotting
axs[0].plot(x, y1)
axs[0].set_title('Top Plot')

axs[1].plot(x, y2)
axs[1].set_title('Bottom Plot')
axs[1].set_xlabel('X-axis')
axs[1].set_ylabel('Y-axis')

# Fix overlapping layout
plt.tight_layout()

# Show plot
plt.show()
Output: