Export plots as high-resolution PNG
Description:
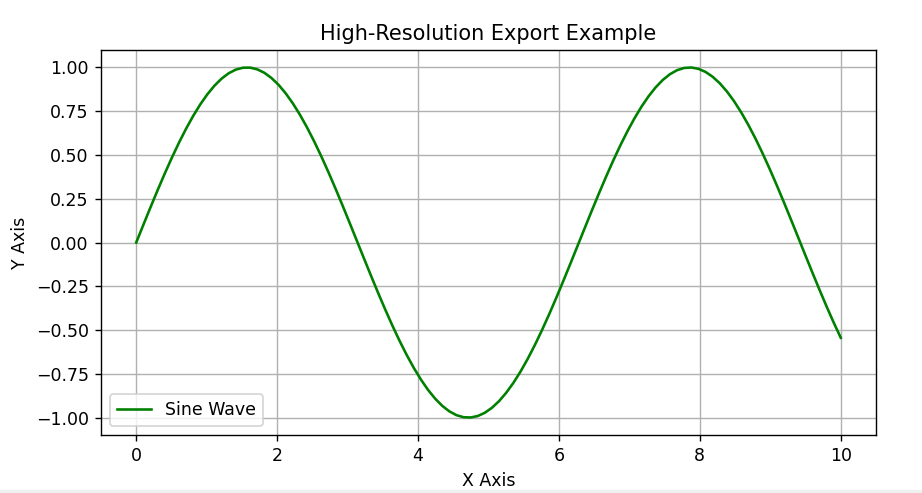
This code shows how to export a plot as a high-resolution PNG image using matplotlib by setting the dpi (dots per inch) parameter in the savefig() function.
Code Explanation:
-
First, we import matplotlib for plotting.
-
Then we create sample data and generate a simple plot using
plt.plot(). -
Instead of just showing the plot, we use
plt.savefig()to export it as an image file. -
We set the
dpi(dots per inch) to a higher value like 300 or 600, which means better quality. -
We also specify the file name and format (e.g., PNG).
-
This method is useful when you need print-quality plots for reports, research papers, or presentations.
Program:
import matplotlib.pyplot as plt
import numpy as np

# Sample data
x = np.linspace(0, 10, 100)
y = np.sin(x)

# Create the plot
plt.figure(figsize=(8, 4))
plt.plot(x, y, label='Sine Wave', color='green')
plt.title('High-Resolution Export Example')
plt.xlabel('X Axis')
plt.ylabel('Y Axis')
plt.legend()
plt.grid(True)

# Save the plot as high-resolution PNG
plt.savefig("high_res_plot.png", dpi=300)  # You can set dpi=600 for even higher quality

# Show the plot (optional)
plt.show()
Output: